OTTAWA ONTARIO
Real Estate Market Update
February 2025
Is 2026 the year you are planning to buy or sell a home in Ottawa? Do you hear the news and think that it might be the wrong time to be looking to buy or sell? Well, don’t go anywhere. I’m here to help you understand what’s going on in the Ottawa market so that you’ll be better prepared to decide whether it’s the right time for you to buy or sell. I’ll also give you my thoughts on what we may see in this coming year within Ottawa’s Real Estate Market.
In this update, I’ll cover what happened in December 2025 and January 2026, but also look back at 2025 as a whole to show you how things trended over the entire year. The statistics I share are specifically for the City of Ottawa boundaries, which differ from what you see released by the Ottawa Real Estate Board, as the boundaries they use include outlying small towns. They also use different definitions for property styles and types.
Months of Inventory
The first thing I’ll talk about is Months of Inventory. The months of inventory is a measure, or ratio, of how many homes are on the market and how many homes have sold in a given month. It represents how many months it would take to sell all of the currently listed homes, given the current rate of home sales, if no more homes were listed for sale. Since it is affected by how many homes are on the market and how many homes are selling, it is always shifting. Months of Inventory changes with the seasons. The MOI is typically lowest in the spring months, and then slowly climbs through till winter, sometimes with a temporary drop with an active fall market.
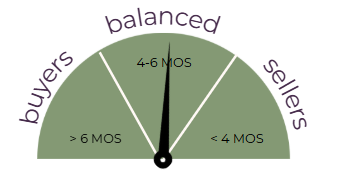
The MOI for all properties in Ottawa in December was 4.7 months and 4.4 months in January.
This was up slightly from 4.2 months in November. Looking back to last year, the Months of Inventory is up quite significantly, as it was only 3.2 and 3.3 months of inventory in December 2024 and January 2025.
MOI - By Property Type
I will break it down for the three main property categories, because, as you’ll see, they differ quite significantly. Detached homes were at 4.6 months in December but dropped down to 3.9 MOI in January, which is similar to the overall average.
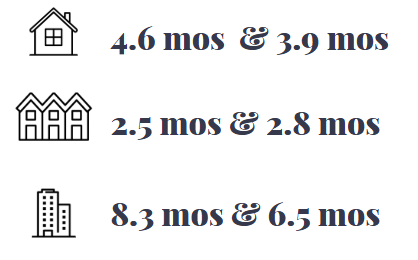
Freehold townhomes saw 2.5 Months of Inventory in December and it climbed to 2.8 months in January, down slightly from 2.65 MOI in November, but up from 1.7 and 1.8 months of inventory the same months last year.
Condominium apartments are selling slower. The MOI has been on a constant climb since April 2025 when it was at 3.95 months. In December, we were seeing 8.3 months of inventory but we did see a drop in January to only 6.5 months of inventory, which brings us back to where it was in November. One year ago, however, we were at 4.3 to 4.7 months of inventory.
Months of Inventory - Chart
This chart illustrates the Months of Inventory for the each property type over the past year.
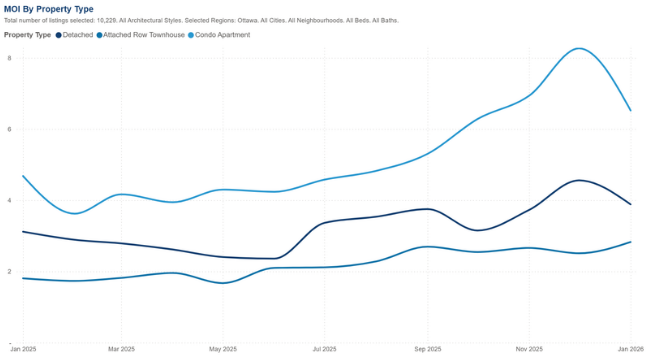
The dark blue line is the Detached segment of the market, which we can see has climbed throughout nearly the full latter half of 2025.
The lower line, in medium blue, represents freehold townhomes. We can see a slow steady climb from below 2 months of inventory up to almost 3 months of inventory.
The condominium apartment line, in the lighter blue, barely dipped below the 4 months of inventory line at all in 2025, and climbed quite quickly up to over 8 months of inventory. Clearly, the condominium market is facing more inventory as compared to sales, and thus a slower market than the other property segments.
Average Sale Price
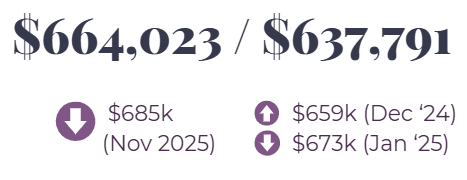
Next, let’s talk about prices. The average sale price of all properties across the City of Ottawa was $664k in December 2025 and $638k in January 2026. This is a drop from $685k in November 2025. Looking back to last year, the average in December 2024 was just shy of $660k, and it climbed slightly to $673k in January 2025.
Breaking it down into property types, the average sale price for a detached home in Ottawa was at about $845k in December and $825k in January. Those averages are down from last year by 2% and 6% respectively.
Looking at the freehold townhome segment of the market, the average sale price in December 2025 was $612k and $604k in January. Looking back a year, the average prices in both December and January were at $616k, so we’re down by 1-2%.
And finally, for the condo apartment segment, the average sale price was $408k in December 2025 and $384k in January, which are 8% and 13% below the same months last year.
Average Sale Price - Chart
This chart shows us the average sale price for all property types combined over the past 9 years. 2025 is the blue line that is at the top of the chart for the latter half of the year. You can see that the average sale prices were actually at record levels from August through December of 2025.
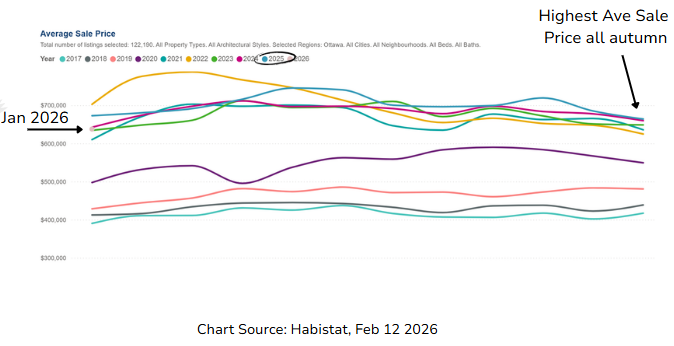
Yet, when we recall what I shared just above, the average sale prices of each of the three segments was lower year over year. Sounds impossible, right? But it’s not, because this overall average is due to the make up of which properties are selling in any given month, and that could mean a higher number of more expensive homes selling, such as detached or semi-detached homes, as compared to condo apartments.
The average price can be pulled up by the breakdown of what is selling, despite the average price for particular segments of the market being lower.
Days on the Market
The next thing we’ll look at is how long it’s taking for homes to sell. This is the Days on Market, and represents the time on market for those homes that have sold. City wide, we saw an average of 48 days on market in December and 59 days on market in January, which was a jump up from 39 days in November. Looking back to last year, we were at 45 and 51 days in those same months.
Breaking it down into property types, we see detached homes took an average of 43 days on the market in December and 56 in January, which was up from 39 days in November. It wasn’t much of a change from last year, however, as the average days to sell was at about 50 days this time a year ago.
Freehold townhomes sold in an average of 40 days in December and 45 days in January, climbing up from 35 days in November. Last year’s townhomes weren’t selling much quicker in those same months, but the market quickly picked up and we saw average days on market at 25 through spring. Will that happen again?
And finally, for condo apartments, the average days on market was 65 in December and 71 days in January, up significantly from 42 in November. Last year, we saw 43 and 57 days in the same two months.
List to Sale Price Ratio
The final metric of how the market is doing that I’ll share is the Average list-to-sale ratio. It is a measure of how close the asking and selling prices are. The List to Sale Ratio was at 97% for December and January. This is a drop from the 98% that it had been at since July, but the same as it was in December 2024. This is very typical for December, as the number of sales drops off quite significantly, and many properties are taken off the market with the intention of re-listing after the holidays. Thus, the properties that remain on the market through December and early January are often those that really need to sell, and thus may be more open to negotiations.
Mortgage Interest Rates
If you’re tracking the mortgage rates to see what sort of mortgage you’d be expecting to be able to get for a purchase or refinance, the rates are generally between just over 3.5% to just over 4%.
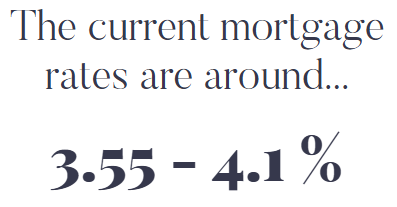
The rates differ depending on your specific situation, downpayment, lender, type of loan (variable or fixed rate) and much more. Speak to your lender, ideally a mortgage broker, to find out what the rates are for your scenario.
Market Trend Insights
So, what are my thoughts on the Real Estate Market in Ottawa as we head into our spring market?
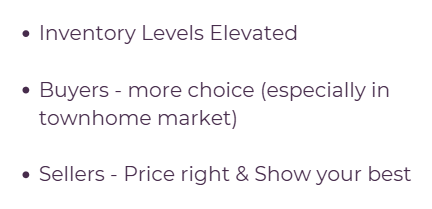
First, inventory levels are elevated. They climbed throughout all of 2025 and we’ve been seeing year over year increases to inventory levels since 2022.
We’re back at 2018 inventory levels right now, and unless something changes with the number of buyers in the market, we’ll likely see further increases to inventory.
So, what does this mean for you?
If you’re a buyer, these higher inventory levels can help. More homes, of course, means more choice when shopping, but it can also mean you have more room for negotiation on homes that have been sitting for longer or aren’t showing like a 10/10. You’ll have the ability to do all of your due diligence, have conditions that protect your interests, and make clear and informed decisions. It’s quite a good market for buyers.
If you’re a seller, it means that you need to do everything possible to have your home stand out above the rest so it’s your home that is selling while others languish on the market. You do this by making sure that your home is fixed up, cleaned up, and as turn-key as possible. Remember that the vast majority of buyers make decisions based on their first impression of a home. Is it move-in ready? Is it priced right? If not, they’ll move on to the other homes that are, and dropping the price later won’t bring them back.
One last thought – the Canadian economy is not the strongest right now. Our GDP growth has been quite stagnant over the past while, and the Federal Government is announcing a lot of layoffs. This disproportionately affects Ottawa as a government town, and this can have a trickle down effect on the Real Estate market here in Ottawa. These are things that we want to keep an eye on in the months to come, as they could perpetuate the uncertainty we’ve been facing and cause a further slowdown in our Ottawa Real Estate market through this year.
Final Thoughts
Regardless of the season, there are always properties being bought and sold.
If you’re looking to talk to someone about the home you own, or the one you plan to buy, you need someone on your side who is going to tell you the truth and lay things out clearly. The key is information and education so that you’re making informed decisions on this huge financial decision.
If you’re looking to connect, my contact details are available in the notes or on my website. Otherwise, I’ll be back again soon with an updated report on the Ottawa Real Estate Market.