OTTAWA ONTARIO
Ottawa Market Update : Fall 2025
Are you looking to buy or sell a home in Ottawa? Are you hearing conflicting information on whether it is or is not a good time to buy or sell? Well, don’t go anywhere. I’m here to help you understand what’s going on in Ottawa’s market so that you are prepared when it’s the right time for you to buy or sell.
This update covers September, October, and November of 2025, specifically for the City of Ottawa boundaries. The numbers will be slightly different than what you see released by the Ottawa Real Estate Board or most other Realtors who often repeat the board’s stats. Also, the area covered by the board includes areas outside of the city boundaries, and they use different definitions for property types.
Months of Inventory
The first thing I’ll talk about is Months of Inventory. The months of inventory is a measure, or ratio, of how many homes are on the market and how many homes have sold in a given month. It represents how many months it would take to sell all of the currently listed homes, given the current rate of home sales, if no more homes were listed for sale. Since it is affected by how many homes are on the market and how many homes are selling, it is always shifting. Months of Inventory changes with the seasons. The MOI is typically lowest in the spring months, and then slowly climbs through till winter, sometimes with a temporary drop with an active fall market.
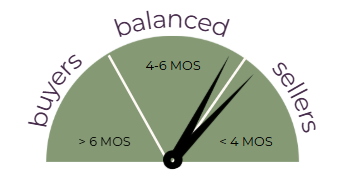
The MOI for all properties in Ottawa this fall started out at about 4 months in September, dropped to 3.75 in October, and then climbed up to 4.25 in November.
This corresponded to a more active pace of sales in October but a slow-down in November. Looking back to how this compares to 2024, our MOI is higher by about 0.5 month. That makes sense because the fall market in 2024 was a bit more active and extended well into November.
MOI - By Property Type
I like to break it down into the three main property categories, because, as you’ll see, the MOI for a freehold townhome is nowhere near what it is for a condominium apartment.
Freehold townhomes continue to be the property category selling the quickest.
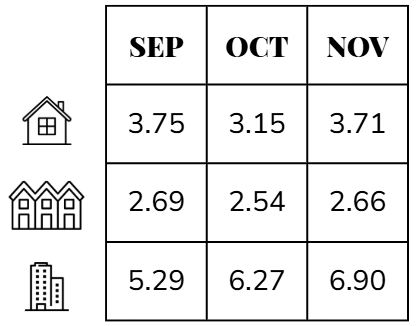
As compared to 2024, the MOI for both detached homes and freehold townhomes are a bit higher, signaling a slightly slower market. For condominium apartments, things are much slower and, as you can see, the MOI for condo apartments has been on a steady increase throughout the fall months. In fact, the MOI has been increasing steadily since April 2025 when we were at just shy of 4 months of inventory.
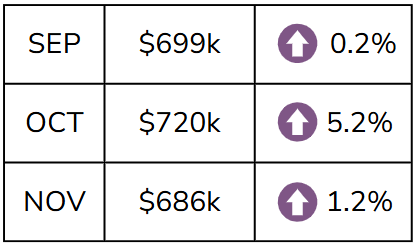
Average Sale Price
Next, let’s talk about prices. The average sale price of all properties across the City of Ottawa in this autumn was $699,178 in September, which is up slightly (by less than $1000) from last month, and September 2024. In October, the average sale price climbed to $719,702 which was over 5% higher than October 2024 and the highest average price Ottawa has ever seen in an October. Yes, even higher than 2021 or 2022.
And, finally, in November, the average sale price was $685,724 which remains the highest ever average sale price for November in Ottawa.
Breaking it down into property types, the average sale price for a detached home in Ottawa was at about $903k in September, $909k in October, and then dropped to $878k in November. All three months were between 3% and 5% higher than 2024 average sales prices.
Throughout the fall, a freehold townhome sold for an average of $617k in September, $611k in October, and $602k in November. Unlike the detached market, these were all lower average sale prices than in 2024, with November being 3.5% below November 2024.
And finally, for the condominium apartment segment of the market, the average sale price actually rose through the fall months, starting out at $432k in September, $436k in October, and $449k in November. These were all higher average sales prices than in 2024. September by just 0.4%, but November up by 5.7% as compared to the same month last year. I will point out one thing about condo apartment sales, though. With fewer sales overall, the average prices can be affected by the type of condos that are actually selling. The average can be pulled up fairly significantly if a few luxury condos sell within any given month.
Days on the Market
The next thing we’ll look at is how long it’s taking for homes to sell. This is the Days on Market, and represents the time on market for those homes that have sold. City wide, we saw an average of 36 days on market for all property types in September, 37 days in October, and 39 days in November. These were up by 1 to 2 days over last year.
** Note ** I made a mistake in my video, stating it was 27 days in October when it was actually 37 days. Oops!! I’m not re-recording it to fix that mistake.
Breaking it down into property types, we see detached homes took an average of 32 days to sell in September, but it quickly climbed to 37 days in October and 39 days in November. It’s comparable to last year, when we saw 34, 36, and 39 days for detached home sales.
For freehold townhomes, the average time to sell was 30 days for both September and October, and then 35 days for November. Last year was slightly quicker at 27, 32, and 33 days.
And, to pull that overall average up, condominium apartments took an average of 51 days in September, but actually dropped off to 40 and 42 days for October & November. Last year was 43, 42, and 38 days respectively for the same months, which corresponds to the higher MOI as well.
List to Sale Price Ratio
The final metric of how the market is doing that I’ll share is the Average list-to-sale ratio. It is a measure of how close the asking and selling prices are. This past month, the List to Sale Ratio was at 98%. This represents no change on a month to month or year to year basis. Looking at the different housing types, detached are at the average of 98%, townhomes were at 99% in September but dropped to the overall average of 98% for October and November. Condo apartments have been sitting at 97% since June of this year.
Mortgage Interest Rates
If you’re tracking the mortgage rates to see what sort of mortgage you’d be expecting to be able to get for a purchase or refinance, you’ll be happy to know that the rates have come down a bit throughout the fall of 2025. Currently, you’re likely to secure a mortgage at rates between 3.5% and 4%, making homes a bit more affordable.
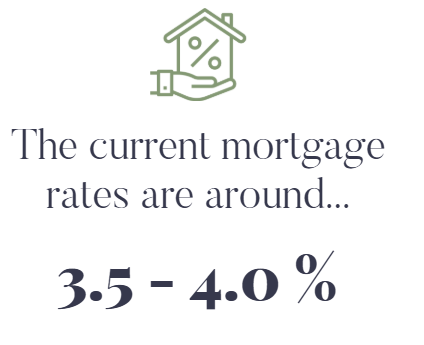
The Bank of Canada made two 0.25% cuts (in September and October) to their overnight lending rate. This influences the variable lending rates we see at the banks. They held the rate steady at their early December announcement, which came out before I recorded this update video. Fixed mortgage rates are set by banks based on the 5-year bond rates, which fluctuate more often. They haven’t changed too much, and are sitting at or slightly below 4%.
These rates I am mentioning are very rough numbers. You need to speak to your lender, ideally a mortgage broker, about your specific situation to find out what the rates are for your scenario. I know a little about mortgages, but they are the experts!
Market Trend Insights
So, what are my take-aways from the Fall Real Estate Market in Ottawa?
Here are three take-aways for the Ottawa Real Estate Market through the fall of 2025, with some tips for 2026 if you’re planning on making a move.

First, inventory levels are still elevated. We have about 28% higher inventory right now at the end of November than last year. This translates into about 730 more properties for sale. The last time we had that many properties on the market in November was 2016. It’s not across property types, though. Detached homes are elevated, but only by 15%, condo apartments by 19%. But it’s actually the townhouse market that is seeing a flood of inventory, 62% higher than last year.
So, for buyers, enjoy the extra inventory and the possibility of having a bit more time to decide and do all of your due diligence. If you’re shopping for a townhome, keep an eye on the inventory levels. An extended period of higher inventory could translate into prices softening a little.
If you’re just at the starting point of thinking of buying, now is the time to reach out to a trusted Realtor and start the conversation. Together with a mortgage broker, you’ll figure out what is within your budget, and start acquainting yourselves with what is going on in the market. Don’t wait till spring – reach out now and get a head start. Then you’ll be ready to buy with confidence when the time is right.
And finally, my message for sellers. Well, it hasn’t really changed from last time. If you’re looking to sell, then you need to price it right and make it show like a 10/10. If it’s not a 10/10, then adjust your price accordingly. Use this next month or two to get all of the little projects done around the house in preparation for listing in 2026.
Final Thoughts
Regardless of the season, there are always properties being bought and sold – even across the holidays. And with inventory levels as they are, there could be some great opportunities to buy at what typically are the lowest prices of the year.
If you’re looking to talk to someone about the home you own, or the one you plan to buy, you need someone on your side who is going to tell you the truth and lay things out clearly. The key is information and education so that you’re making informed decisions. If you’re looking to connect, reach out!
Happy Holidays!